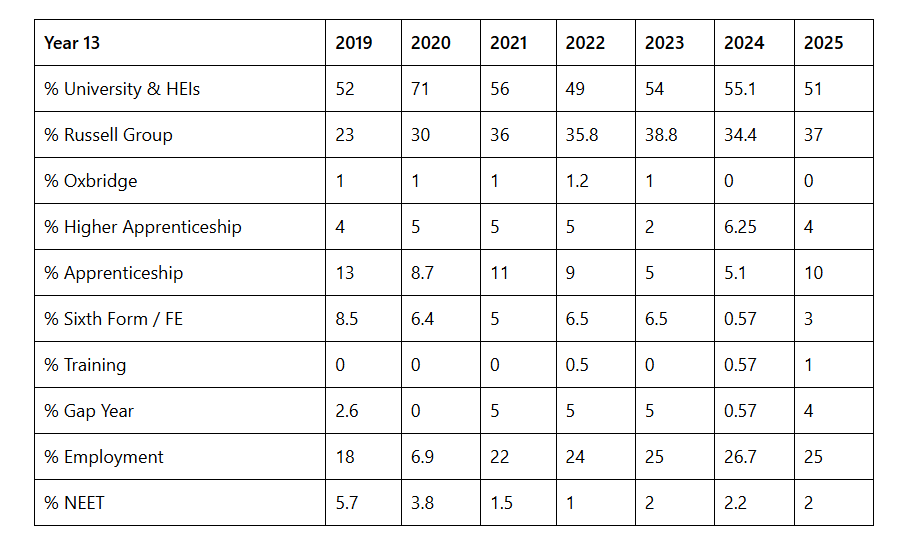
Our CEIAG team work tirelessly to ensure all our students reach their potential and access their chosen career or university. Our NEET figures show that around 98% of our students move onto further study, university, apprenticeship or employment.
Previous year’s figures are updated in May/June each year. Current 2024 figures calculated 01/10/2024 – We work with all NEET students and historically the NEET % will reduce throughout the academic year as we find support these young people into their chosen destinations
Year 13 | 2019 | 2020 | 2021 | 2022 | 2023 | 2024 |
% University & HEIs | 52 | 71 | 56 | 49 | 54 | 55.1 |
% Russell Group | 23 | 30 | 36 | 35.8 | 38.8 | 34.4 |
% Oxbridge | 1 | 1 | 1 | 1.2 | 1 | 0 |
% Higher Apprenticeship | 4 | 5 | 5 | 5 | 2 | 6.25 |
% Apprenticeship | 13 | 8.7 | 11 | 9 | 5 | 5.1 |
% Sixth Form / FE | 8.5 | 6.4 | 5 | 6.5 | 6.5 | 0.57 |
% Training | 0 | 0 | 0 | 0.5 | 0 | 0.57 |
% Gap Year | 2.6 | 0 | 5 | 5 | 5 | 0.57 |
% Employment | 18 | 6.9 | 22 | 24 | 25 | 26.7 |
% NEET | 5.7 | 3.8 | 1.5 | 1 | 2 | 2.2 |